



Understand the metrics
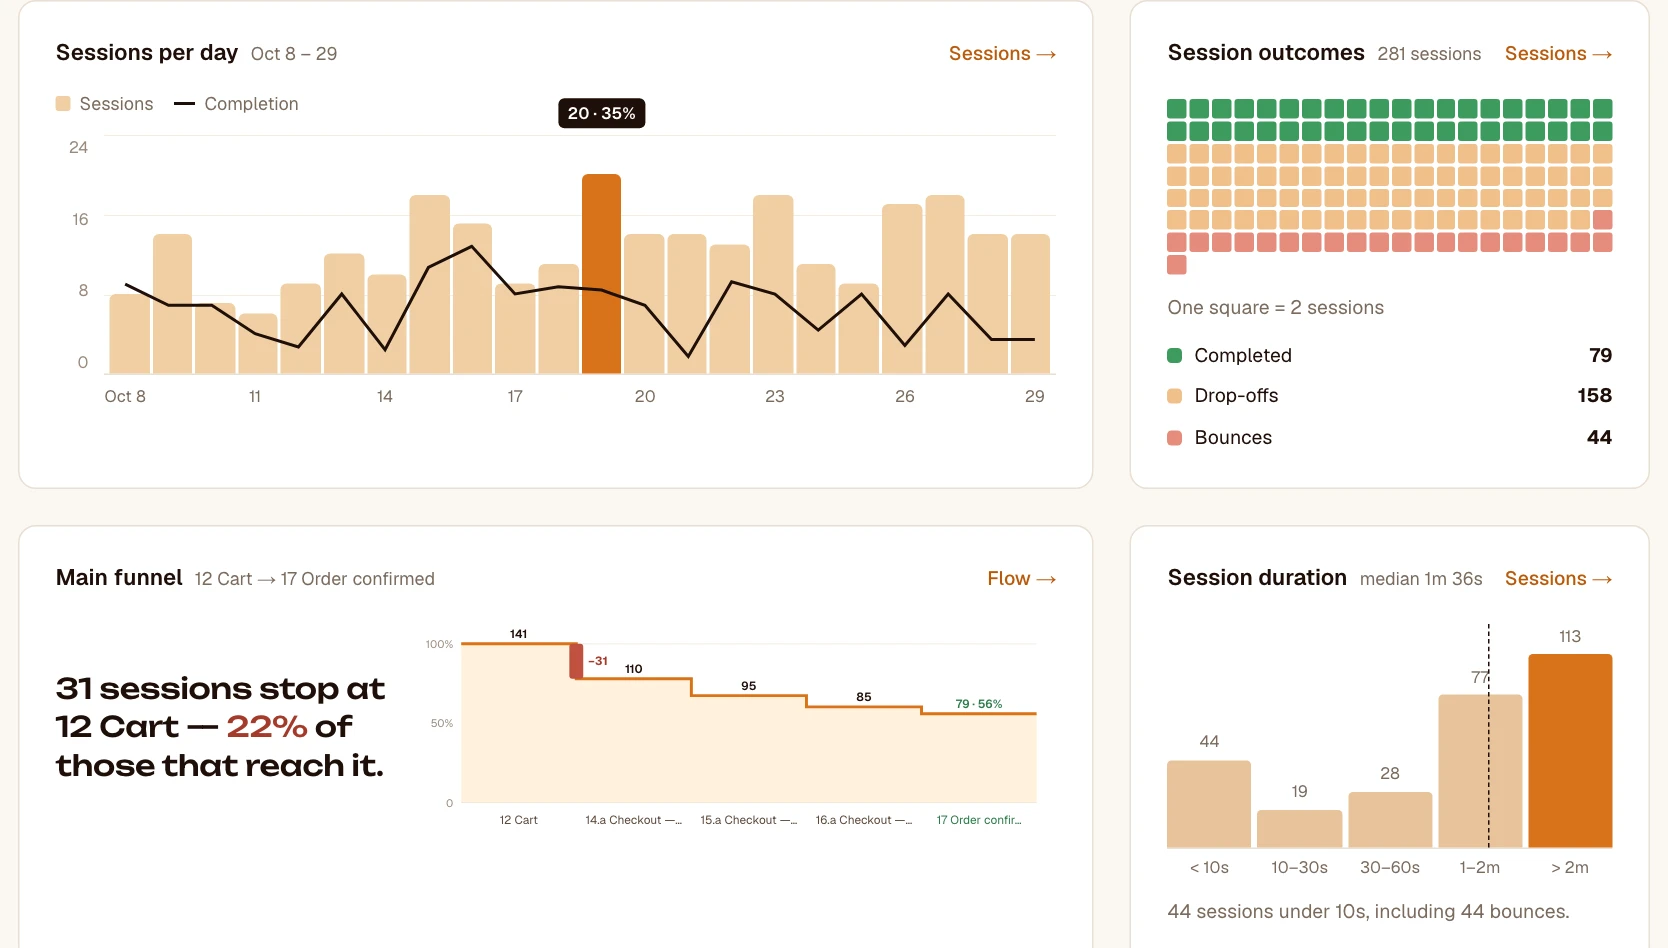
Sessions, completion, bounce, duration… the definition of every number. · 5 min readEvery DASHUND number has a single definition, the same everywhere. All of them are calculated over the period and filters chosen at the top of the view.
Session metrics
- Sessions
- The number of sessions started, meaning prototypes loaded and seen by a tester.
- Unique visitors
- The number of different people (a random identifier per browser and per prototype).
- Completion
- The average of session completions, according to the chosen measure of success: the share of successful sessions, or, for a checkpoint path, the average share of checkpoints seen.
- Drop-off
- 100% minus completion.
- Median duration
- The time between the first and the last action of a session; the median is less sensitive than an average to sessions left open.
- Bounce
- The share of sessions with no click and no screen change.
- Screens per session
- The average number of screens shown, starting screen included.
- Clicks per session
- The average number of clicks.
- Abandoned loads
- Link openings where the person left before loading finished, relative to all openings.
Screen metrics
- Views
- The number of times the screen was shown, including when a session comes back to it several times.
- Unique sessions
- Sessions that saw the screen at least once.
- Time on screen
- The time spent before changing screens; for the last screen of a session, until the last action. Median.
- Entries
- Sessions that start on this screen.
- Exits and exit rate
- Sessions that stop on this screen (excluding goal screens), and their share among those that saw it.
- Off-target
- The share of clicks that landed outside the prototype’s interactive areas.
Quality alerts
The Dashboard warns you when something skews the data: sessions blocked by a Figma login screen (file not shared properly), too many clicks without a position, or lots of abandoned loads.
Was this article helpful?