



Read the Flow
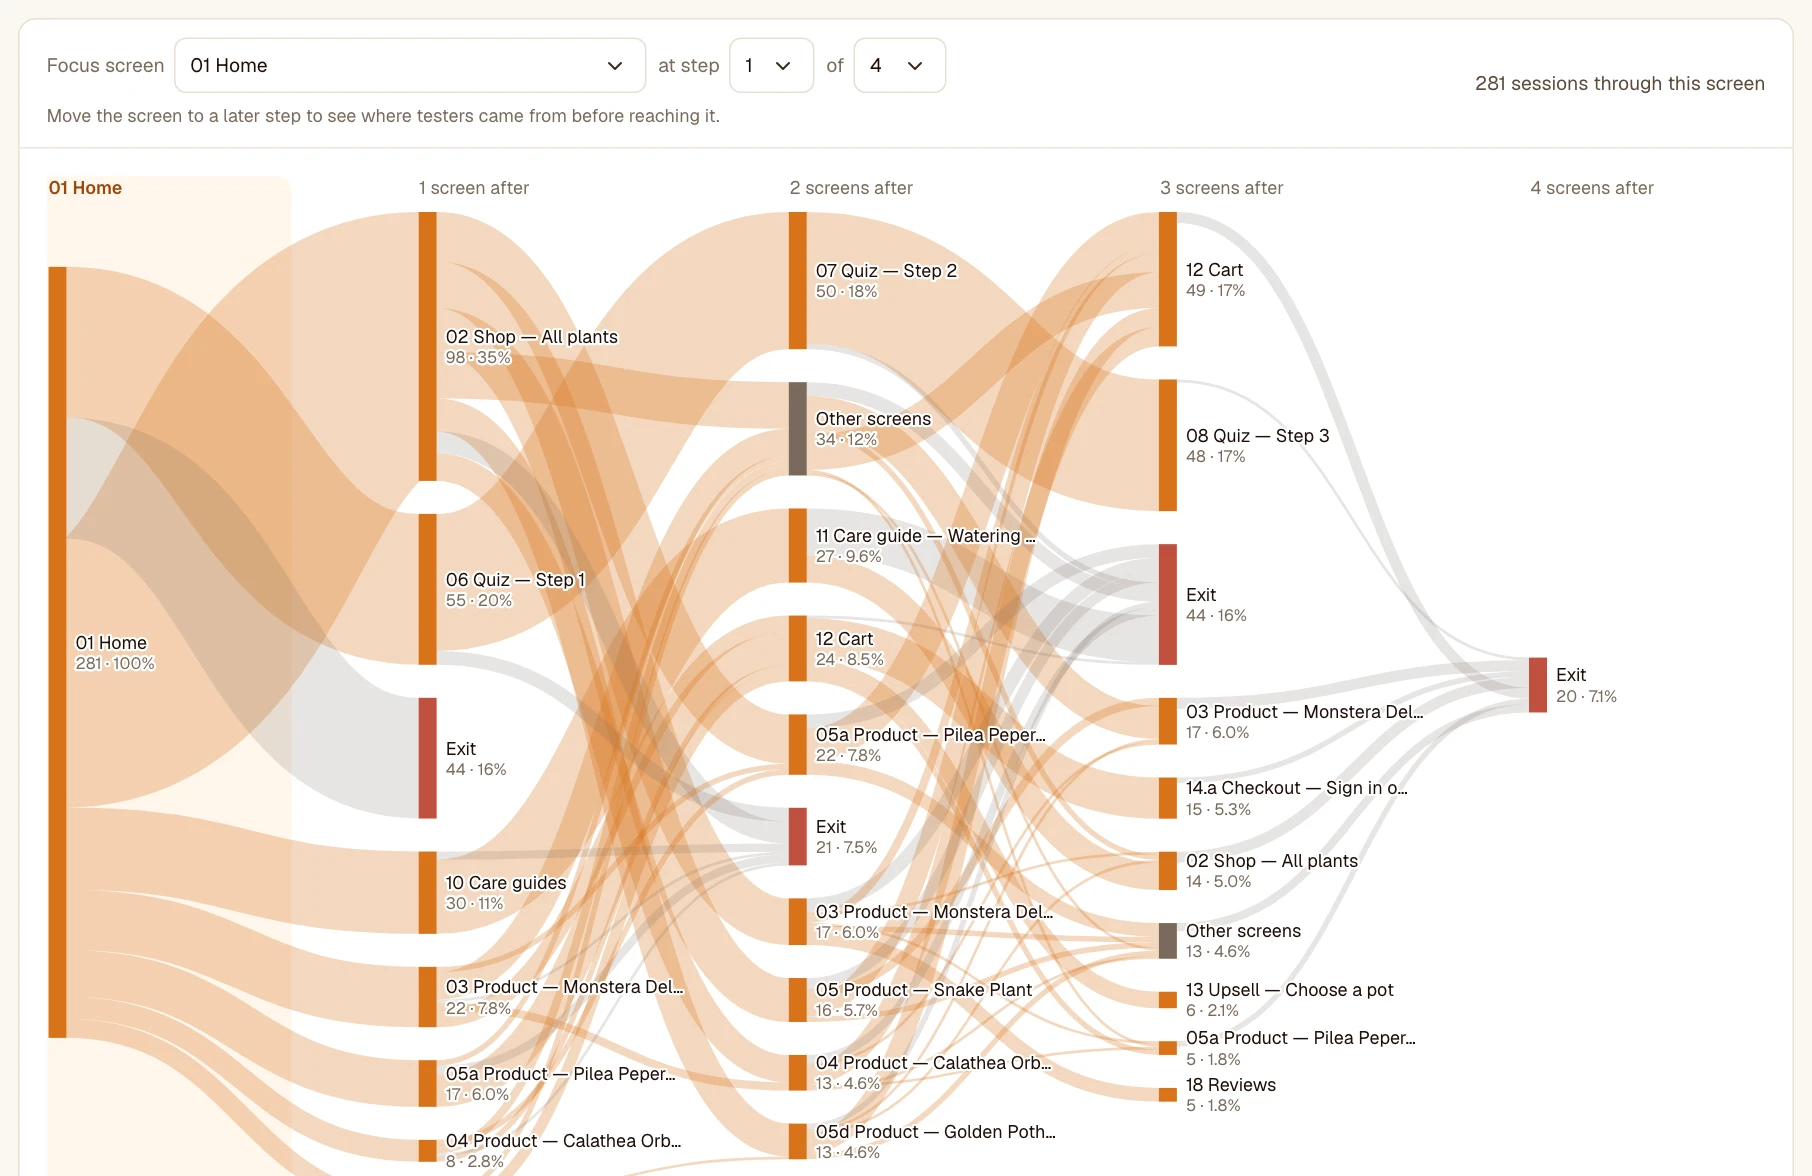
Where testers go, where they come from, and where they drop off. · 4 min readThe Flow shows the real path testers took, screen by screen, from left to right. The thicker a link, the more it was taken.
Reading the diagram
- Each column is a step. Under each screen: the number of sessions and their share.
- Exit (in red): the sessions that stop there. A big exit right before your goal deserves a look.
- Other screens: a step’s little-visited screens, grouped to keep the diagram readable.
- Hover a link to see its volume and its share of departures.
Go further
- Click a screen to open its details: heatmap, time spent, previous and next screens.
- Click a link to see the sessions that made that transition.
See where testers come from
The settings read like a sentence: Focus screen [screen] at step [N] of [number of steps]. Place the screen further than step 1 to also see where testers went before reaching it.
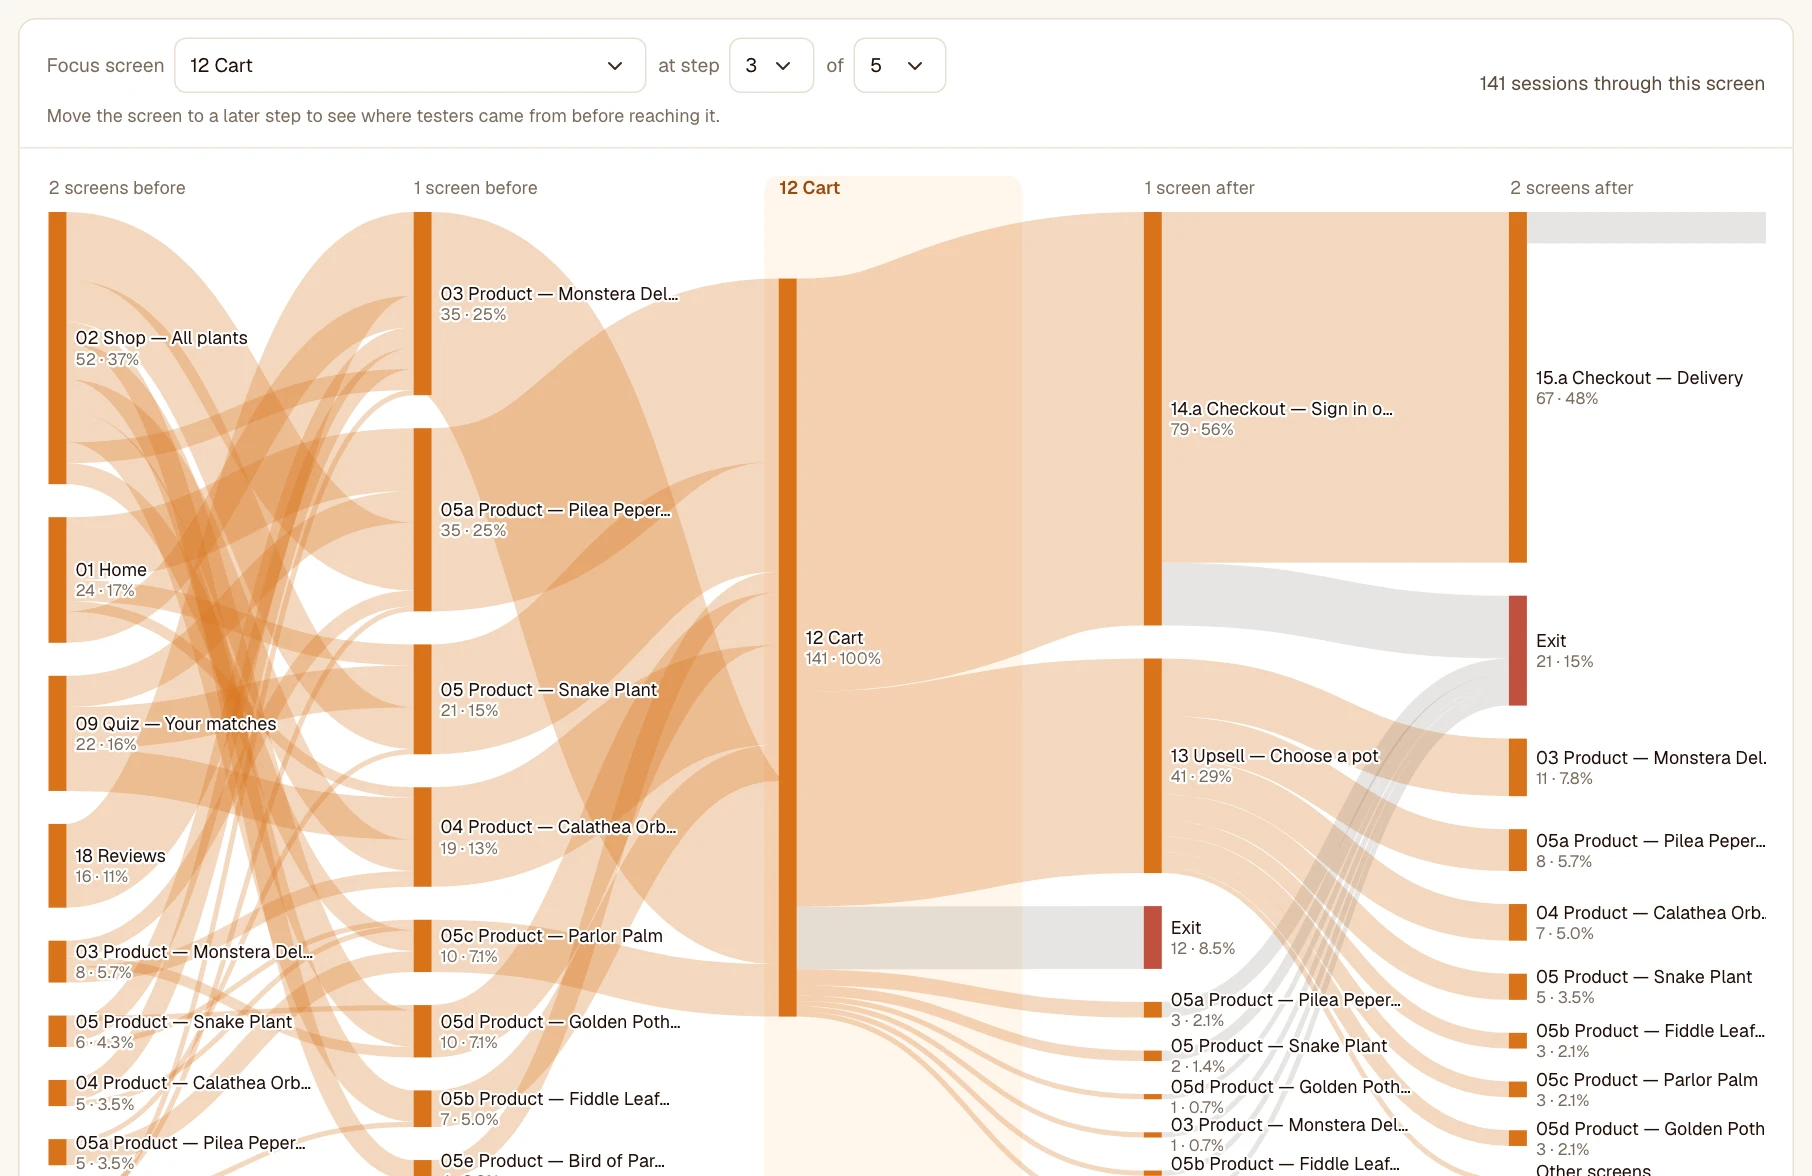
- Columns are named relative to it: “2 screens before”, “1 screen before”, the screen, “1 screen after”…
- Session start (in gray) groups the testers who reached the screen faster: their path had fewer screens before it.
- A screen seen several times in a session counts from its first visit.
Was this article helpful?