



Read the heatmaps
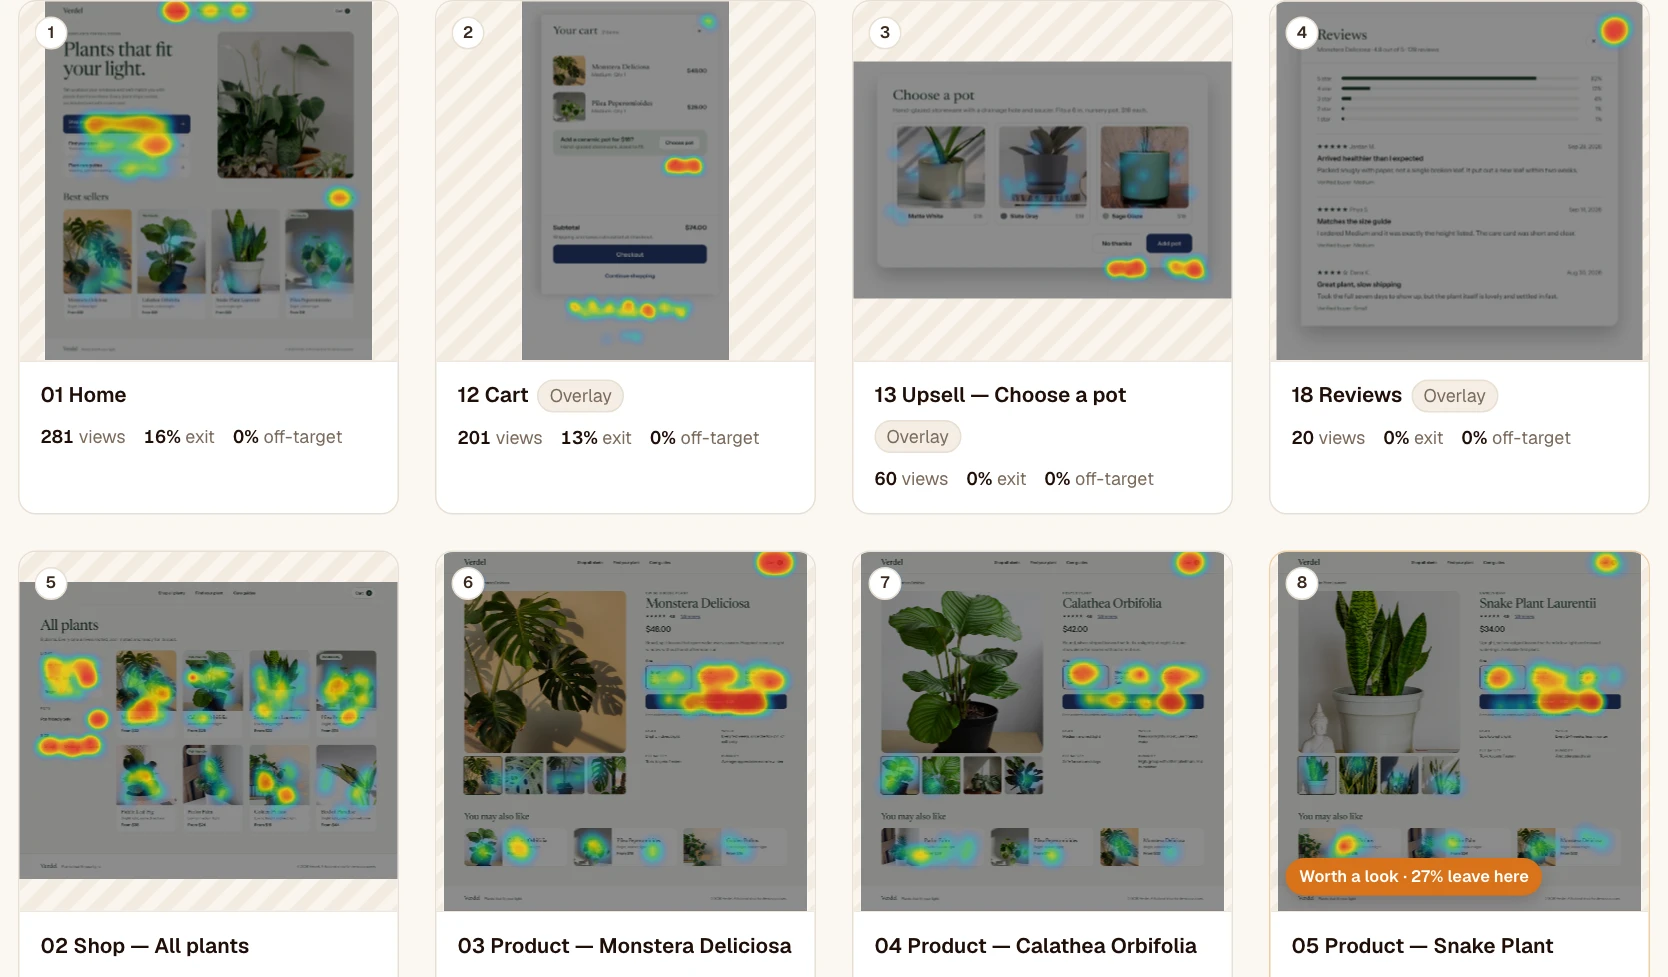
Where people click, including outside the planned areas. · 4 min readThe Heatmaps tab shows every screen of the prototype in a gallery, with its heatmap already displayed. At a glance, you see where people click, where they stop and where they struggle.
The gallery
- Sort by path order, by views, by exit rate, by off-target clicks or by time spent. Each card’s number reminds you of its place in the path.
- The “Worth a look” badge flags a screen that stands out: at least 30% off-target clicks, at least 25% exits (excluding goal screens), or time spent at least double that of the other screens.
- The list view (the icon next to the grid) keeps every metric in a table, sortable by column.
A screen’s details
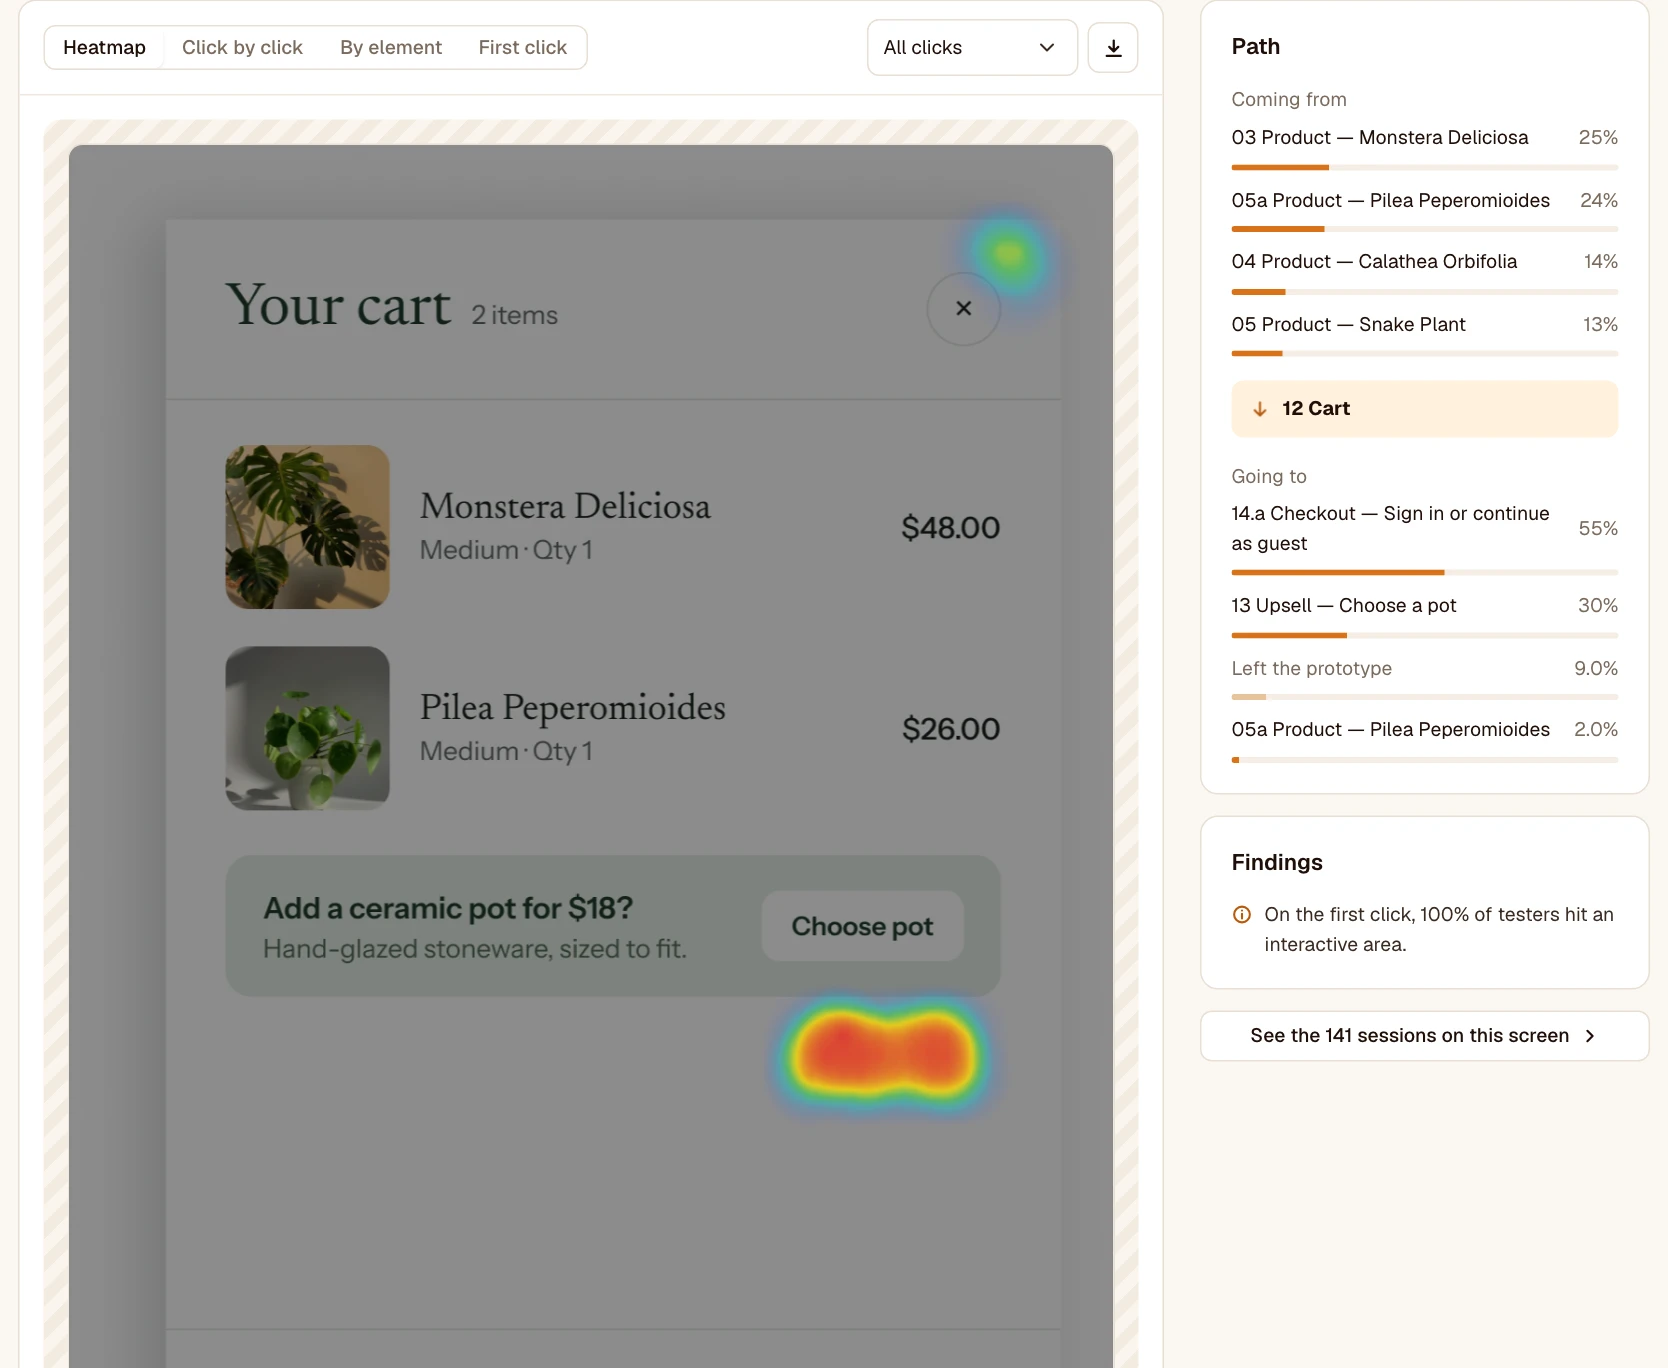
Open a screen: its four key numbers (views, median time, exit rate, off-target clicks) are at the top, then the screen appears in large, with four ways to read the clicks. For each one, you can choose which clicks to show: all of them, only those on an interactive area, or only off-target ones.
- Heatmap: hot areas are where people click the most.
- Click by click: each click is a dot, orange on an interactive area, gray off-target. More precise when there are few sessions.
- By element: the share of the screen’s clicks on each element clicked, shown on it. Very telling in a presentation.
- First click: where testers click first when they arrive on the screen. If that first click often lands off-target, the screen isn’t clear.
At the top right, the arrows move to the previous or next screen of the path, also with the keyboard arrows. On the right: where testers come from and where they go, findings in plain sentences when a number stands out, and the sessions that saw the screen.
Export a heatmap
The download button, at the top right of the screen, exports it as a PNG with what’s shown (heatmap, clicks, elements or first clicks), at the screen’s size: ready for a presentation or a ticket.
Clicks you don’t see
- In content that scrolls inside the screen (a carousel for example), a click can land on a part missing from the image: it’s counted, but not placed.
- A click whose position Figma doesn’t provide is counted in the volumes, without appearing on the image.